一.前言相信大家在管理公司網路流量的時後...面對Mrtg圖時...明明就知道整個流量是Peak的狀態...但就是不知道那台電腦在Download或者上傳資料...以致於整個Network bandwidth都塞爆...還得一台一台去查那台電腦流量很" busy "...這樣不是很累嗎?現在得知有 ntop 這樣好用的工具...實在是大家的福氣ㄌㄟ...安裝時可以參考NetMan兄的
如何設定 ntop 文件...或是直接看Readme都有教你如何安裝...做法大同小異...只是在compiler的過程中也許會遇到一些狀況...要想辦法排除就是...
還有..如果你是把 ntop 放到NAT上來執行時...看你平常的流量會不會很大...以及NAT那台電腦是不是夠強啦...像偶們本身是用celeron 400的電腦來當做內部的NAT...平常有幾十G的流量在跑...圖形化的 ntop常常會停掉...而且也不能達到我要的即時知道內部電腦的流量狀況...這時你可以選用文字模式來監控(intop)...它雖然沒有Web介面來的好...不過 intop 比較符合大家的需求...web界面只是比較炫而已...
二.準備測試系統: Red Hat Linux 7.1 and 7.3 都裝過沒問題...
官方網站:
NTOP Network Monitor 目前它有分Stable and Preview的版本...兩種也都裝過...
Stable(2.0) :
http://snapshot.ntop.org/stable/ntop-2.0-src.tgzPreview(2.0.99) :
http://snapshot.ntop.org/tgz/ntop-current.tgz
三.開始實作1.開始進行解壓工作(以Preview版本為例)﹕
| [root@mondeo home]# tar zxvf ntop-current.tgz |
先compiler gdchart
[root@mondeo home]# cd ntop-current/gdchart0.94c
[root@linux gdchart0.94c]# ./configure .
.
Do not forget to build:
1. gd-1.8.3/libpng-1.2.1
2. zlib-1.1.4/ |
最後會看到提醒你要build libpng and zlib.......再繼續下一步之前...必須先compiler 那兩樣...先build libpng...
[root@linux gdchart0.94c]# cd gd-1.8.3/libpng-1.2.1/
[root@linux libpng-1.2.1]# cp scripts/makefile.linux Makefile
[root@linux libpng-1.2.1]# make |
再build zlib﹕
[root@linux gdchart0.94c]# cd ../../zlib-1.1.4
[root@linux zlib-1.1.4]# ./configure
[root@linux zlib-1.1.4]# make |
再來就可以compiler gdchart:
[root@linux zlib-1.1.4]# cd ..
[root@linux gdchart0.94c]# make |
gdchart的部份到這邊告一段落...接下來主角上場 ntop ...
2. Compiler ntop:
回到 ntop 目錄
[root@linux gdchart0.94c]# cd ../ntop/
[root@linux ntop]# ./configure |
這個部份有遇到一些問題...因為通常NAT不會裝mysql...不過它預設是會去認mysql...所以如果你也有遇到mysql的問題的話...可以加個參數 --disable-mysql 把mysql給disable掉..下一步...
這部份會花比較久的時間...document上面有說可以make check看看...個人是覺得不用啦...因為這會多花大概一倍的時間來做這件事...有點多此一舉...接著再﹕
|
[root@linux ntop]# make install |
如果都沒錯誤訊息的話...那你就成功啦..你就可以看到有ntop 以及 intop 可以使用...只剩如何執行它...
3. 執行 ntop: 這邊先介紹圖形化介面..也就是web界面:
| [root@linux ntop]# ntop -P /tmp -u nobody |
第一次執行它會要你輸入admin的password...它預設密碼也是admin...第二次執行就不用再輸入..這時你可以打開web browser..
輸入: http://<your_IP>:3000 你就會看到如下圖Sample_1 (Network Load Statistics)...這是2.0.0的圖形化界面:

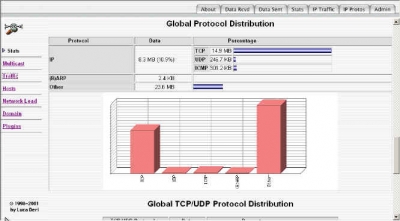
Sample_2(Global Protocol Distribution):
不過你會發現...執行上面指令會把terminal視窗佔住...你可以先"ctrl+z"先 stop 住...再下" bg %1"(假設它在你的jobs裡數字是1)...
這樣就可以丟到背景執行...或是重新執行下面指令:
| [root@linux ntop]# nohup ntop -P /tmp -u nobody & |
這樣就可以讓你丟到background and leave this terminal don't stop this command....當然你也可以把這行加到/etc/rc.d/rc.local的最後一行...讓它一開機就自動執行...它還有許許多多的參數...你可以從web上來看看需要加上那些...。
4.文字模式(intop): 文字模式個人比較常用...因為它不會在流量很大的時後...讓你的系統 loading 很重...而且得到的資訊是我比較想要的..由於執行後會產生幾個檔...因此建一個你自己要拿來存放的目錄比較不會搞混﹕
[root@linux ntop]# intop
-- intop 0.0.1 (Jul 1 2002) -- The first interactive ntop program.
(C) Copyright 2000 L. Deri and R. Carbone. All rights reserved.
It allows you to control the power of ntop using fingers rather than mouse!
This program is free software; you can redistribute it and/or modify
it under the terms of the GNU General Public License as published by
the Free Software Foundation; either version 2 of the License, or
(at your option) any later version.
This program is distributed in the hope that it will be useful,
but WITHOUT ANY WARRANTY; without even the implied warranty of
MERCHANTABILITY or FITNESS FOR A PARTICULAR PURPOSE. See the
GNU General Public License for more details.
Initializing intop engine.... Please wait.
01/Jul/2002 23:45:24 Initializing IP services...
01/Jul/2002 23:45:24 Initializing GDBM...
01/Jul/2002 23:45:24 Resetting traffic statistics...
01/Jul/2002 23:45:25 Started thread (1026) for network packet analyser.
01/Jul/2002 23:45:25 Started thread (2051) for DNS address resolution.
01/Jul/2002 23:45:25 Started thread (3076) for address purge.
Type ? for help.
intop> |
看到這個後...可以打? for help....或是來監聽網卡上面的流量:
intop>sniff -i eth001/Jul/2002 23:47:16 Initializing network devices...
01/Jul/2002 23:47:16 Truncated network size to 1024 hosts (real netmask 255.255.255.0)
01/Jul/2002 23:47:16 Resetting traffic statistics...
01/Jul/2002 23:47:16 Resetting traffic statistics...
starting sniffer on eth0 (with no filter enabled)...
intop@eth0>
|
這時後打top...就是你想要的資訊囉...公司那台電腦比較 busy...原則上都知道了...
intop@eth0>top
intop 0.0.1 (Jul 1 2002) listening on [eth0]43 Pkts/5.7 Kb [IP 4.9 Kb/Other 828] Thpt: 0.0 /0.0
Host Act -Rcvd- Sent TCP UDP ICMP
192.168.0.2 B 3.7 Kb 1.3 Kb 3.7 Kb 0 0
192.168.0.10 B 1.3 Kb 3.8 Kb 1.1 Kb 162 0
kelly S 0 243 0 0 0
|
執行的大概情形就是如上....
5.大功告成做到這個階段...算是大功告成...趕緊找一台機器來試試吧...從此內部電腦的流量就透明化啦...
以上只是個人測試結果...如有錯誤...煩請指教!!!


